Latest
Planning the perfect peak
A data driven approach for planning Video Games consoles
The importance of peak for retailers
With between 30% and 40% of all retailer sales coming from the final three months of the calendar year, planning the perfect peak is on all retailers’ minds once the new year hangover has cleared. UK spend on online retail sites on Black Friday last year reached £1.49bn – a 7.3% increase from 2017, which goes against the predicted slowdown. It’s not just about Black Friday either. In 2018, retailers took a more aggressive approach to grabbing market share. 67% of all discounts offered were introduced between the Monday and Thursday leading up to Black Friday – a 17% increase from 2017. Such retail strategies at this time of year are changing the shape of customer demand.
Using external data such as Google Trends
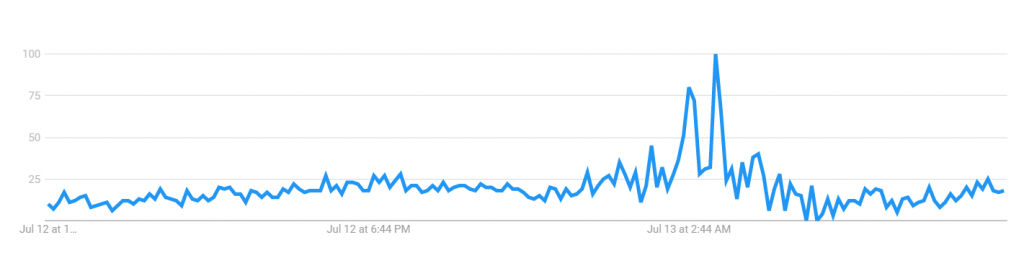
Having a customer first approach driven by data intelligence should be at the forefront of all retail planning. So what is at a retailer’s disposal today? Google Trends is a website released by Google in 2006 to analyse search query demand around the world. The trends are standardised to a percentage demand index such that at its most popular point in history, the index is 100%. This is standardised for the period of interest. For example, below we see two trend series for the same search query in Great Britain, the first being over 5 years, the second being over the last 24 hours.
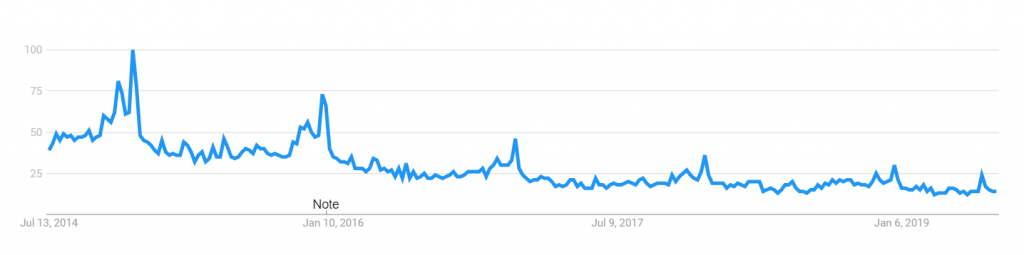
In this post, we will take an in depth look at games consoles in Great Britain, finding out how the peak landscape has changed in the last 6 years, and how we can use this data to inform strategy.
The Black Friday Movement
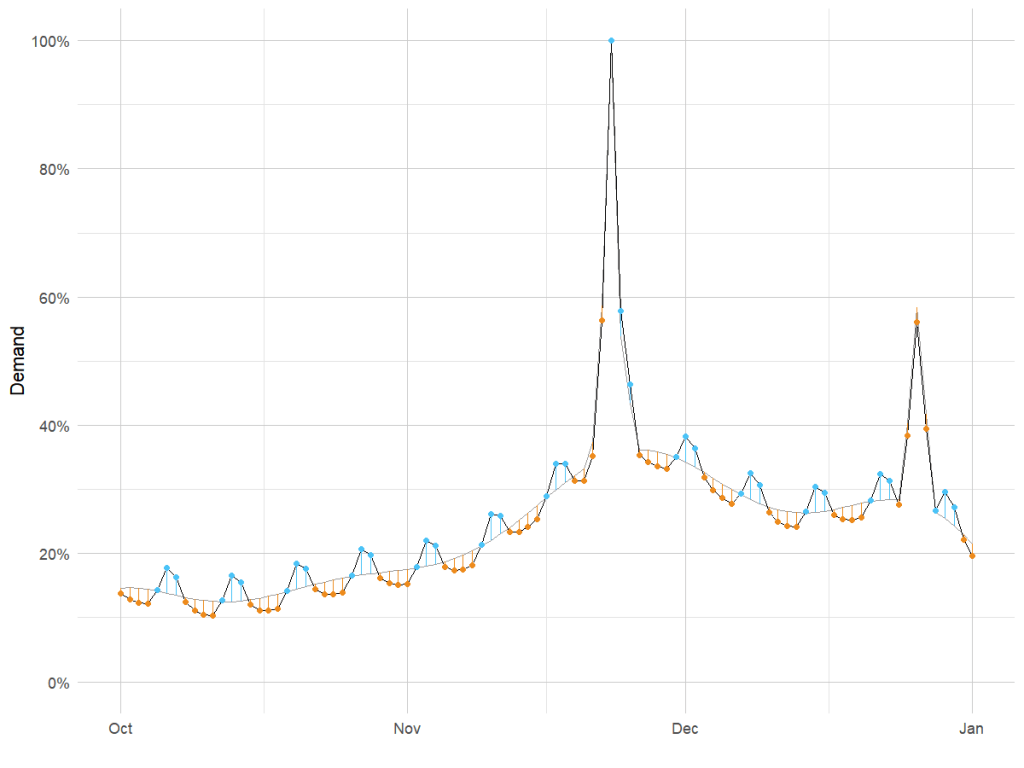
As we can see from the Google Trends graphs in the first section, the data can be spiky. Google Trends takes a sample of the overall search query volume when calculating demand and there will be lots of sources of variation over time, e.g. new product releases or promotions by major retailers. To get a cleaner view of what the trend is, we are using Facebook’s Prophet tool. This uses forecasting methods to identify the underlying trends in the data and capture spikes for the key events such as Black Friday and Boxing Day sales.
We looked at games consoles in Google Trends for two of Britain’s largest retailers, Amazon and Argos, from October 2013 to January 2019. We have pooled the data together and used Prophet to capture the underlying trends.
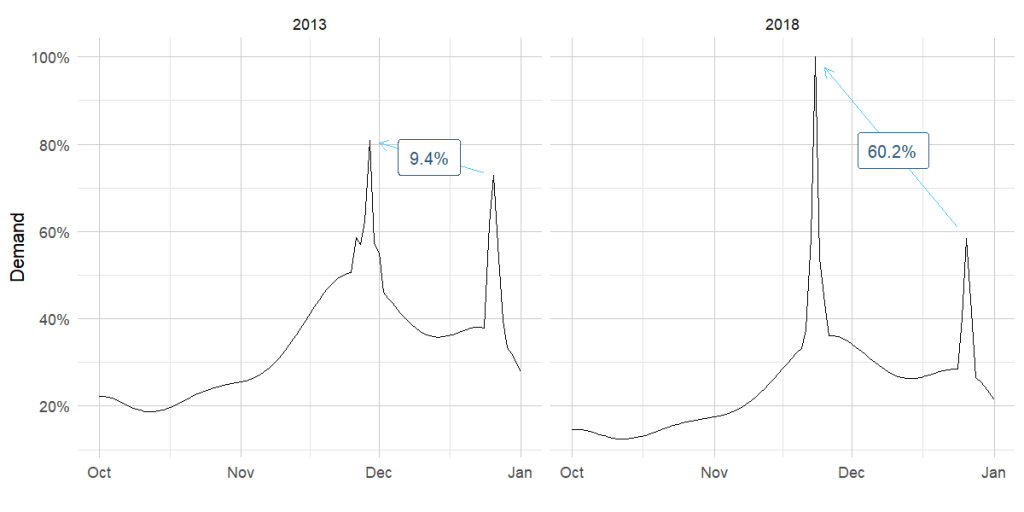
The first question is whether data from 2013 is still useful in planning peak demand. What we ascertain is that back in 2013, there was an average uplift in demand of 9% over Black Friday than during the Boxing Day period. Five years later in 2018, this has increased to 60.2% (see the visualisation below). Budgeting strategies back in 2013 are not as relevant today.
Peak breakdown
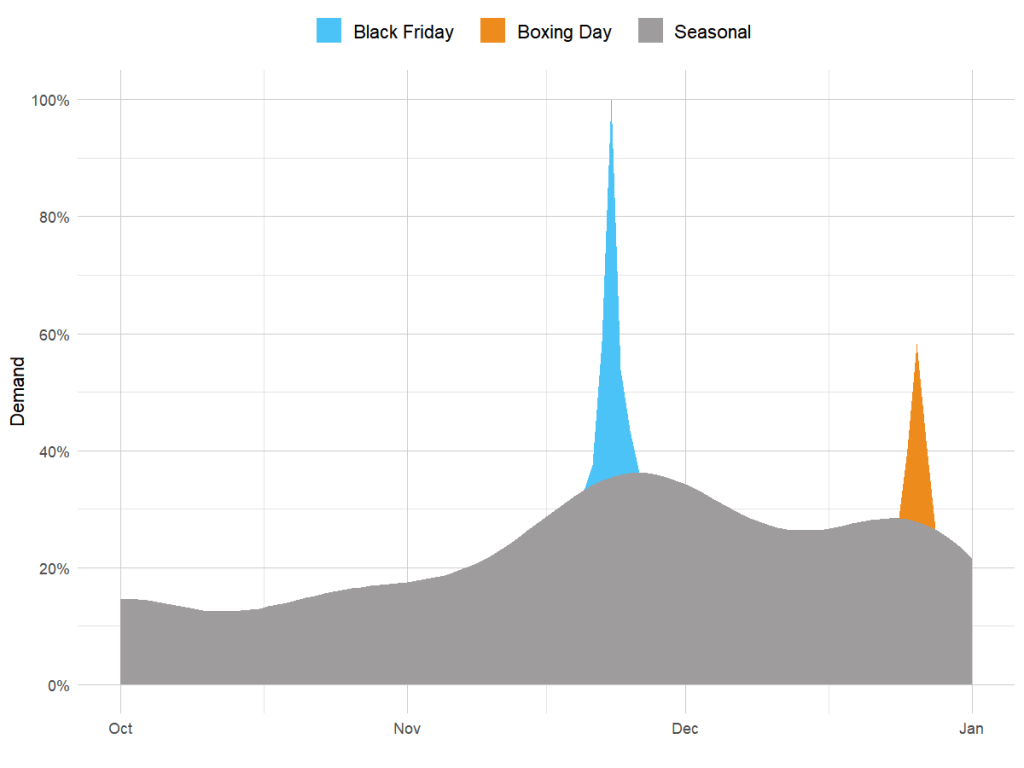
Our overall goal is to get a picture of what demand will look like for October-December 2019. To do so it’s useful to break down search demand into components. This starts by trying to figure out what the seasonal demand would look like without having the two major promotional periods Black Friday and Boxing Day. As we saw in the last section, the uplift in demand can change dramatically as the major players such as Amazon change how they sell their products. The visualisation below shows what the search demand may look like without the promotional peaks for 2018. Black Friday and Boxing Day contribute a 185% and 110% increase in demand respectively.
This is helpful for planning budgets at a larger scale, across the three-month period. If we believe that there will be a larger/smaller Black Friday peak this year, we can alter the expected uplifts. For planning at a more granular level e.g. for phasing across a given week, we need an additional component. The below visualisation shows how that once we have accounted for this, we see an increase in demand during the weekend. Here the grey line is the original trend; the black line shows the impact of the day of the week.
Budget planning
We have now broken down the peak landscape into four components: the natural seasonal demand, Black Friday, Boxing Day and weekly seasonality. We can use this as a basis for budget planning.
In the bar chart below, the grey bars are where we expect the natural demand to sit across the Black Friday period, using the visualisations above. From this there are two additional effects we need to consider:
- What promotions is the retailer running? When will they run? How large will these promotions be? I.e. we need to estimate the uplift the promotions will have on increasing demand to the website
- How much incremental profit do we expect from our promotional activity? From previous years, if we see that conversion rates shift by say an additional 100% on Black Friday, then it warrants pushing more money into this day to capitalise in the increased demand
Our retail intelligence platform, Purchase Predictor, combines sales data with demand to get a picture of what this “headroom” is, i.e. the additional sales opportunity. The orange bars show an example of how budget allocation shifts after taking into account this headroom.
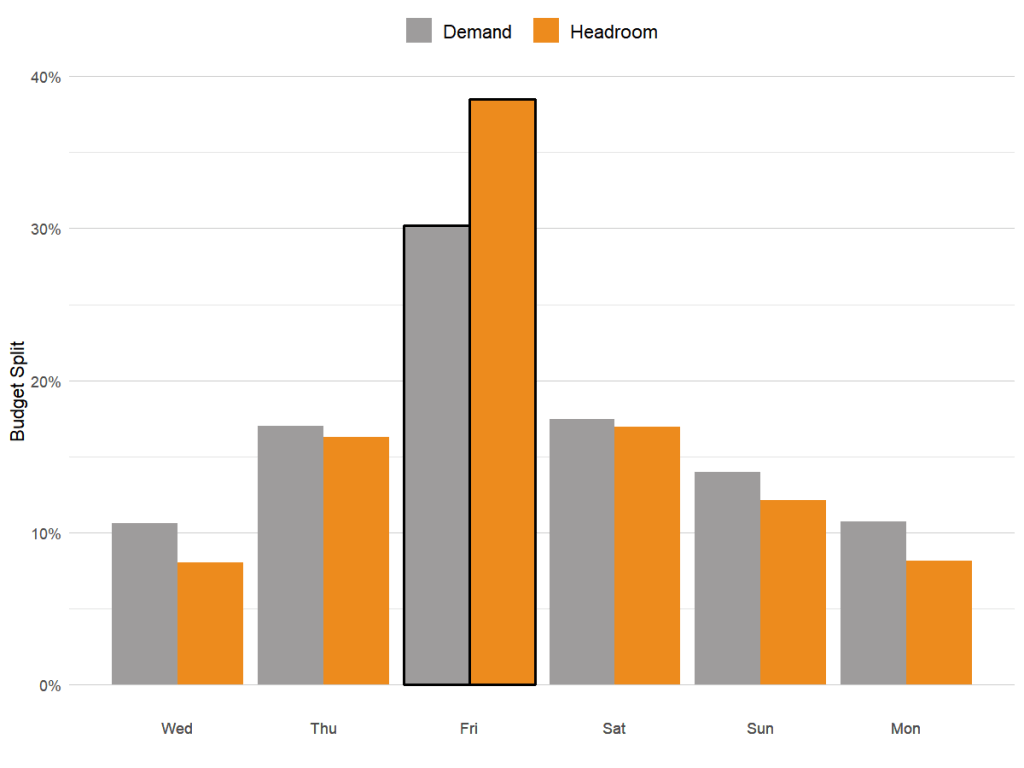
The value of Google Trends is that it provides us with a benchmark for performance for every product category. We can use this data to inform strategy regarding when to put our promotions live to optimising where we allocate our budgets.
Key takeaways for planning a perfect peak
- The importance of peak trading shouldn’t be underestimated. Retailers need to take learnings from the previous year and work with their internal data insights team or 3rd party to plan marketing budgets and campaigns in good time
- Data from Google trends is a great starting point for informing budget planning. Combining this data with other macro and micro retailer and market factors ensures that you can plan budgets and media campaigns with a higher degree of accuracy and react to changes
- Using historical demand data is important to support future planning. Be careful though to not look too far back. Using data more than 2 years old could be misleading and not relevant to expected customer behaviour
- We can clearly see the shape of peak has changed: there is a clear shift away from increasing demand in Boxing day coupled with the growth in Black Friday and the week surrounding this, which we expect to remain true as Black Friday is now an established trading period
Sources:
https://retail-assist.co.uk/top-ten-black-friday-stats-2018/
Opportunities to link internally:
Ready for change? Let's talk
Speak to Summit