Latest
Google Store Visits
The offline value of online marketing
Understanding the customer journey to purchase
A customer has no boundaries when looking to purchase a product from a retailer. Each has their own unique preferences which need to be understood. Retailers who both sell online and in a physical retail store need to understand the customer journey that leads to a purchase. Recent studies show that almost 29 percent of consumers prefer to research products online and buy them later in a physical store. Only 7.5 percent prefer the reverse—to research products in physical stores and buy them later online. A retailer who fails to measure these dynamics as part of their media planning and budgeting will be undervaluing their digital investment and making incorrect decisions in respect of future planning.
What are store visit conversions?
If you are a retailer who sells both online and in store, then you may be eligible to track store visits influenced by paid marketing on Google. Google can track phone location history and couple this with store location to determine who has visited. If they have recently clicked on an advertisement on Google, across any device, then this can be tracked and reported in Google Ads. If you want to read more about the metrics and how this is set up, see Google’s store visit conversions guide.
Why are they important?
The usefulness of this information depends on how many incremental visits an advertisement may drive. This is tricky to determine without designing an A/B test to isolate this effect. However, we can get a relative view of the uplift in activity for one product against another. Say we have two products, A and B, that we know convert comparably online, but A has significantly more store visits. Then we can say that either A naturally converts better in store and is a more valuable product and/or our advertisements for A drive more incremental store visits. Whilst we can’t distinguish fully between the two, we can improve on our beliefs regarding the value of our products, relative to one another.
Measuring success
Due to the importance in planning and optimising to offline store metrics, we developed a module within Forecaster to estimate offline sales & revenue from Google’s store conversion data. We take in signals from online sales data, de-duping against any overlap such as click & collect conversions, and co-ordinate with our clients to estimate in store conversion rates and average order value shifts.
By dividing the estimated offline sales over the combined offline and online (total) sales, we determine what percentage split of the sales are in store. If the propensity to buy each product behaves the same online as in store, then these percentage splits will converge to the same value.
The below table and commentary explains the concept:
| Product | Total Sales | Offline Sales | Offline Sales Split | Theoretical Percentage Range | Significant? |
| A | 10 | 7 | 70% | 10% – 90% | No |
| B | 100 | 40 | 40% | 35% – 65% | No |
| C | 1,000 | 560 | 56% | 45% – 55% | Yes |
- Offline Sales Split – offline sales divided by total sales. We are testing whether there is enough sales data for each product to determine whether this split differs from the grouped averaged, in this example being 50%.
- Theoretical Percentage Range – If you flip a coin you have 50% chance of getting a head. For 2 coins flipped, you have a 25% chance of getting 2 heads. For 10 coins the percentage chance of getting 10 heads is 0.1%. The more coins we flip, the less likely we are to see an extreme percentage of Heads appear.
The same principle applies here, so for product A we have observed a 70% split. It’s likely that with 10 total sales and an expected split of 50% that we could naturally observe a 10% to 90% value i.e. 1-9 offline sales. However, if we observe 1,000 total sales, we would need to see a split outside of the 45% and 55% range (450 to 550 offline sales) to have confidence that the average is not converging to 50%. The data visualisation in the next section builds upon this concept.
- Significant? If the split value is outside the theoretical range, then we can say that the product drives more/less offline sales than the average product in the range. In this case only product C is significant, as the 56% split observed is outside of the range.
Jewellery case study
We have studied jewellery products to try to understand which products we may be under valuing by reporting only to online Cost of Sales (COS), Cost Per Acquisition (CPA) or Return on Investment (ROI) metrics. The scatter plot below of the total sales against the offline sales split shows this theory in action.
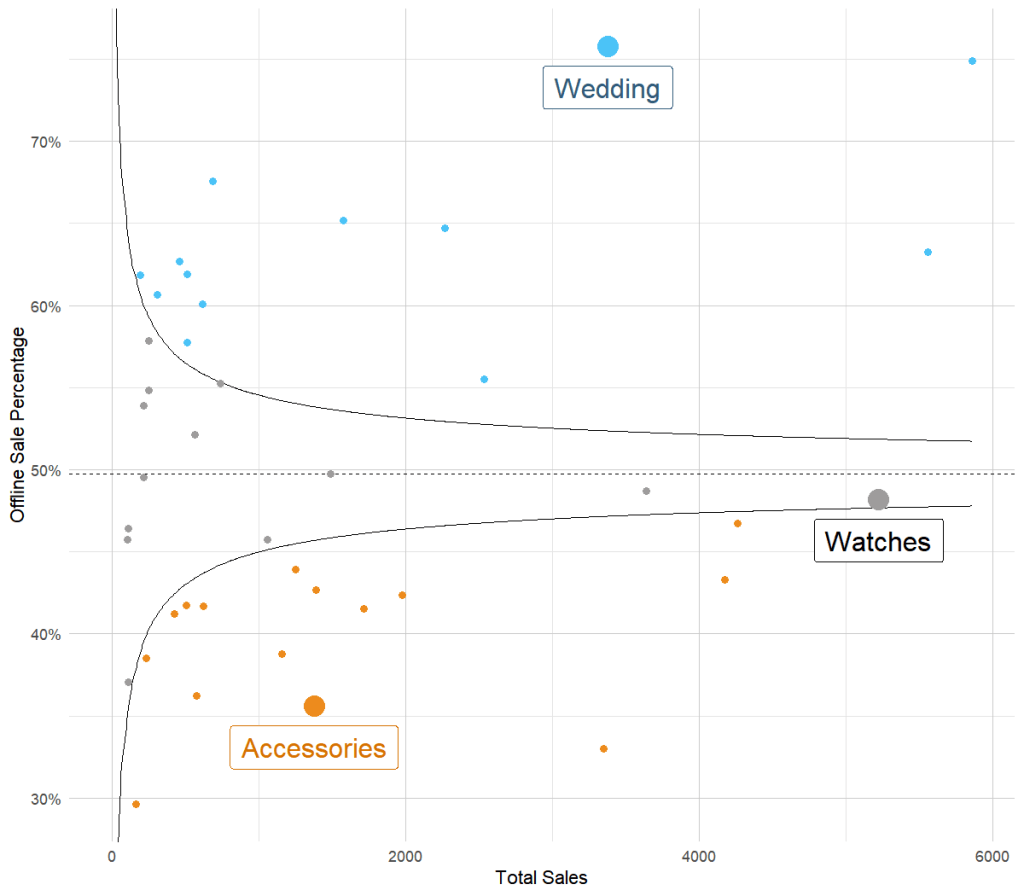
- The black solid lines show the theoretical percentage range whilst the dashed line shows the average split across the product range at just under 50%. This is known as a funnel plot, the black lines shrink towards the dashed line as we gain more information.
- The blue points have enough evidence to say that there is a higher likelihood of converting in store e.g. Wedding Rings. These are once in a lifetime purchases and so the in-store experience is the most important touchpoint in this sales journey.
- Conversely orange points show the opposite effect e.g. Accessories are typically lower cost so the desire to come into store is lower.
- Grey points are those that either don’t have enough sales data to make an informed decision or can be branded as an average jewellery product e.g. Watches. If we break out watches based on their value, we see this shift, similarly to how we compared wedding rings and accessories. The decision on whether to split to a more granular product depends on the richness of the client’s conversion data.
For a jeweller, there is good reason to set up store visit conversion tracking and start to report and optimise their Google paid search budgets on more than online ROI.
Key takeaways for measuring and planning with offline sales data
- Research Online and Purchase Offline (ROPO) is a significant part of a retailer’s sales – this needs to be recognised at the board level when making decisions about store openings, closures and marketing budgets.
- Using store visits in combination with sales data signals is a great starting point for any multichannel retailer to understand the role of digital marketing channels in driving offline sales.
- Certain verticals and products within retail are more likely to drive customers into store following initial online research. Creating models at this granular level will increase the accuracy of offline sales predictions.
- When reviewing bid management solutions for paid search, ensure that they can factor in such metrics into their media planning, budgeting and optimisation, like Forecaster can do today.
Resources:
Research online and purchase offline statistics:
https://lab.getapp.com/research-online-purchase-offline-omnichannel/
Case study to show the impact of store visit conversions – Jewellery:
Ready for change? Let's talk
Speak to Summit